This tool provides users with data to inform their decisions on siting, permitting, enforcement, and infrastructure improvements. Demographic and socioeconomic data, coupled with state agency data such as proximity to active high air emission facilities or wastewater treatment facilities, will be used to help underserved and overburdened communities in Maryland.
Disclaimer
The MDEnviroScreen EJ score represents a combined measure of pollution and the potential vulnerability of a population to the effects of pollution. The EJ score in MDEnviroScreen does not include data from every available map layer. For example, it does not include race/ethnicity, language proficiency, or age, however, MDE has made that information available for informational purposes only. Collecting and displaying this data allows users to evaluate the relationships between demographics and pollution burden, and can be used to better understand issues related to environmental justice and racial equity in Maryland. MDE cautions users against using the "Underserved" map layer, or its subcategories, in any manner that would be considered discriminatory under applicable law.
EJ Score Calculation
The term “EJ Score” means an overall evaluation of an area’s environment and environmental justice indicators, as defined by MDE in regulation, and aggregates data in the following sub-indices: (1) pollution burden exposure; (2) pollution burden environmental effects; and (3) sensitive populations, including socioeconomic factors. Find a printer-friendly version of our detailed methodology
here.
We strongly encourage permit applicants to look beyond the summary EJ Score into the specific indicators above the 75th percentile in a given community to identify their unique concerns, and to note that MDEnviroScreen will not fully capture every concern.
Climate Vulnerability Score
The Climate Vulnerability Score (CVS) determines the susceptibility of communities to climate impacts at the census tract level. The CVS integrates the existing Environmental Justice (EJ) Score with five additional climate variables (Tree Canopy Coverage, Urban Heat Island, Drought, Storm Surge, and Flooding) , establishing climate vulnerability as a function of both climate exposure and community impact. The resulting percentile scores classify vulnerability into four categories: baseline, low, moderate, or high. The CVS is calculated using two primary sub-indices.
The Community Impact Sub-index assesses a community's capacity to adapt and its existing susceptibility to hazards, considering Adaptive Capacity (measured by tree canopy cover per the Climate Solutions Now Act of 2022) and Sensitivity (measured by the Environmental Justice Score).
The Climate Exposure Sub-index aggregates the potential impacts from four specific climate hazards: flooding, storm surges, drought, and urban heat islands, assessing the overall gradient of risk for the community from these hazards.
Maryland Code, Environment Article §1–701 & §1–702
The CVS informs the annual report analyzing state spending on greenhouse gas reduction, also required by the Climate Solutions Now Act of 2022 (Maryland Code, Environment Article §2–1304).
Overburdened Communities
State law defines Overburdened Communities as any census tract where three or more environmental or health indicators are higher than 75 percent of other tracts statewide. These indicators include levels of fine particulate matter in the air, ozone, proximity to industrial facilities or hazardous waste sites, traffic levels, rates of asthma-related emergency room visits, and other health and environmental conditions.
Underserved Communities
State law defines Underserved Communities as any census tract in which:
- At least 25% of the residents qualify as low-income
- At least 50% of the residents identify as nonwhite
- At least 15% of the residents have limited English proficiency
Permit Application Requirements
State law (HB 1200) requires applicants seeking a permit under §1-601 of the Environment Article of the Annotated Code of Maryland, or any permit requiring public notice and participation, to include the EJ Score for the census tract where the applicant is seeking the permit in their application.
Applicants must include the MDEnviroScreen Report with the EJ Score as part of the permit application upon submission. An application will not be considered complete without the report. Applicants should also include a discussion of the community's environmental exposures. This will help determine the best way to engage with the community.
Communities with high indicator scores, particularly those with five or more indicators at or above the 75th percentile, should have more opportunities to participate in the permit process and understand a project's potential impacts. Certain permits may require applicants to take action if a census tract has an overall EJ Score greater than the 75th percentile. Applicants should follow these existing permit instructions where applicable.
Instructions for Permit Applicants
To generate an EJ Score,
launch the MDEnviroScreen using the link at the top of this page. Input the address or coordinates (as “longitude, latitude”) of the proposed installation in the search bar at the top right of your screen. The tool will zoom in and pin the location at the center of the screen. Click on the illuminated dot, and a dialogue box will automatically generate (see below).

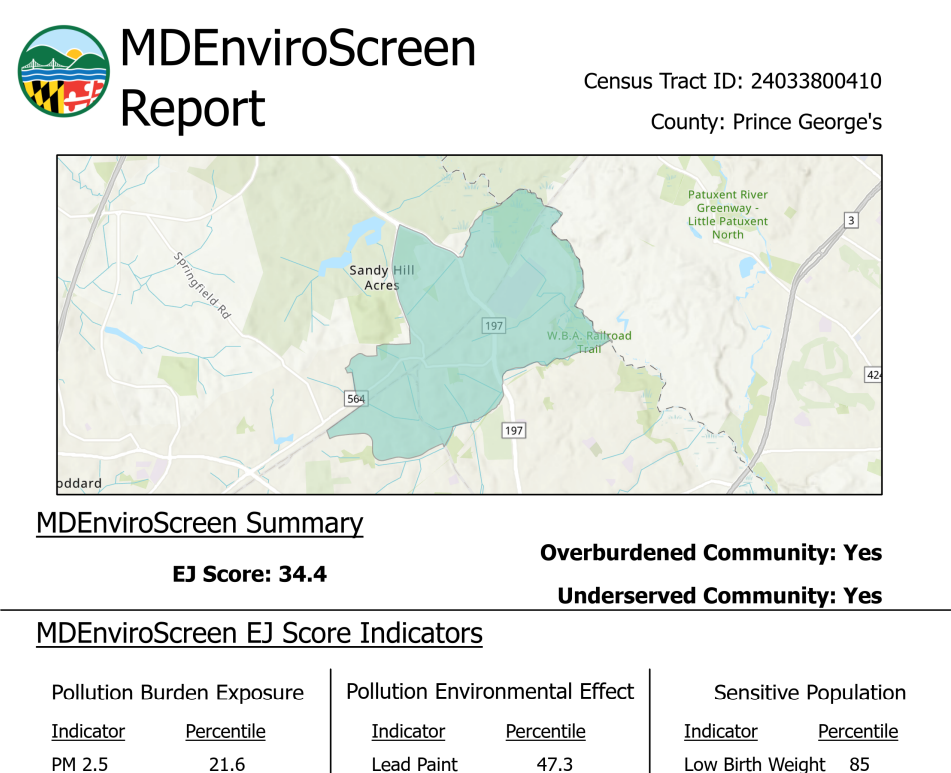
Click “Download the Report” below the MDEnviroScreen Summary table to generate a printer-friendly MDEnviroScreen Report (see below).