Historical Air Quality Data
Main_Content
Status of Ozone Pollution in Maryland
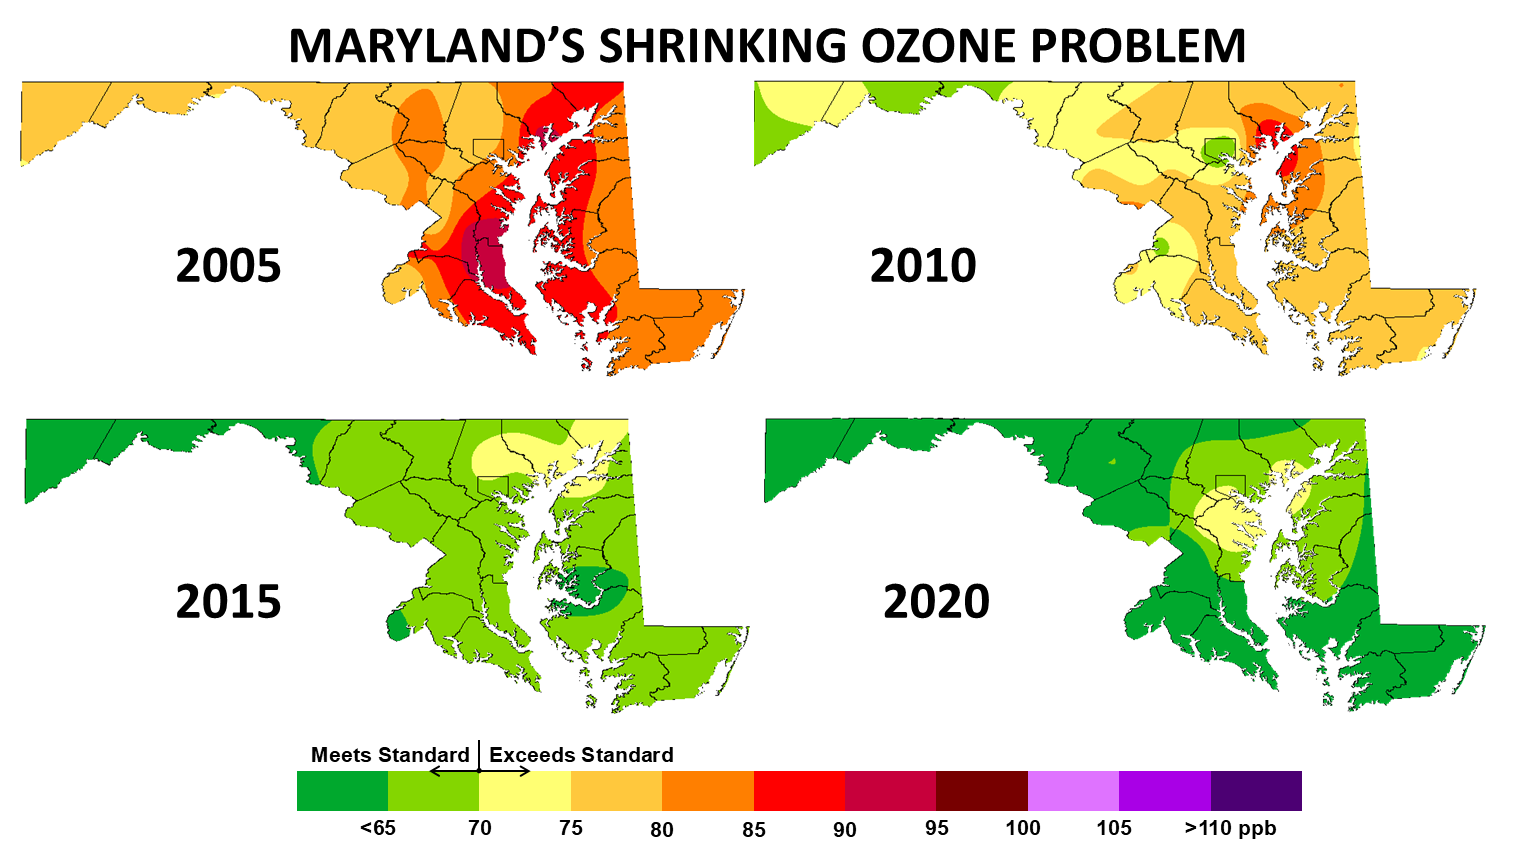
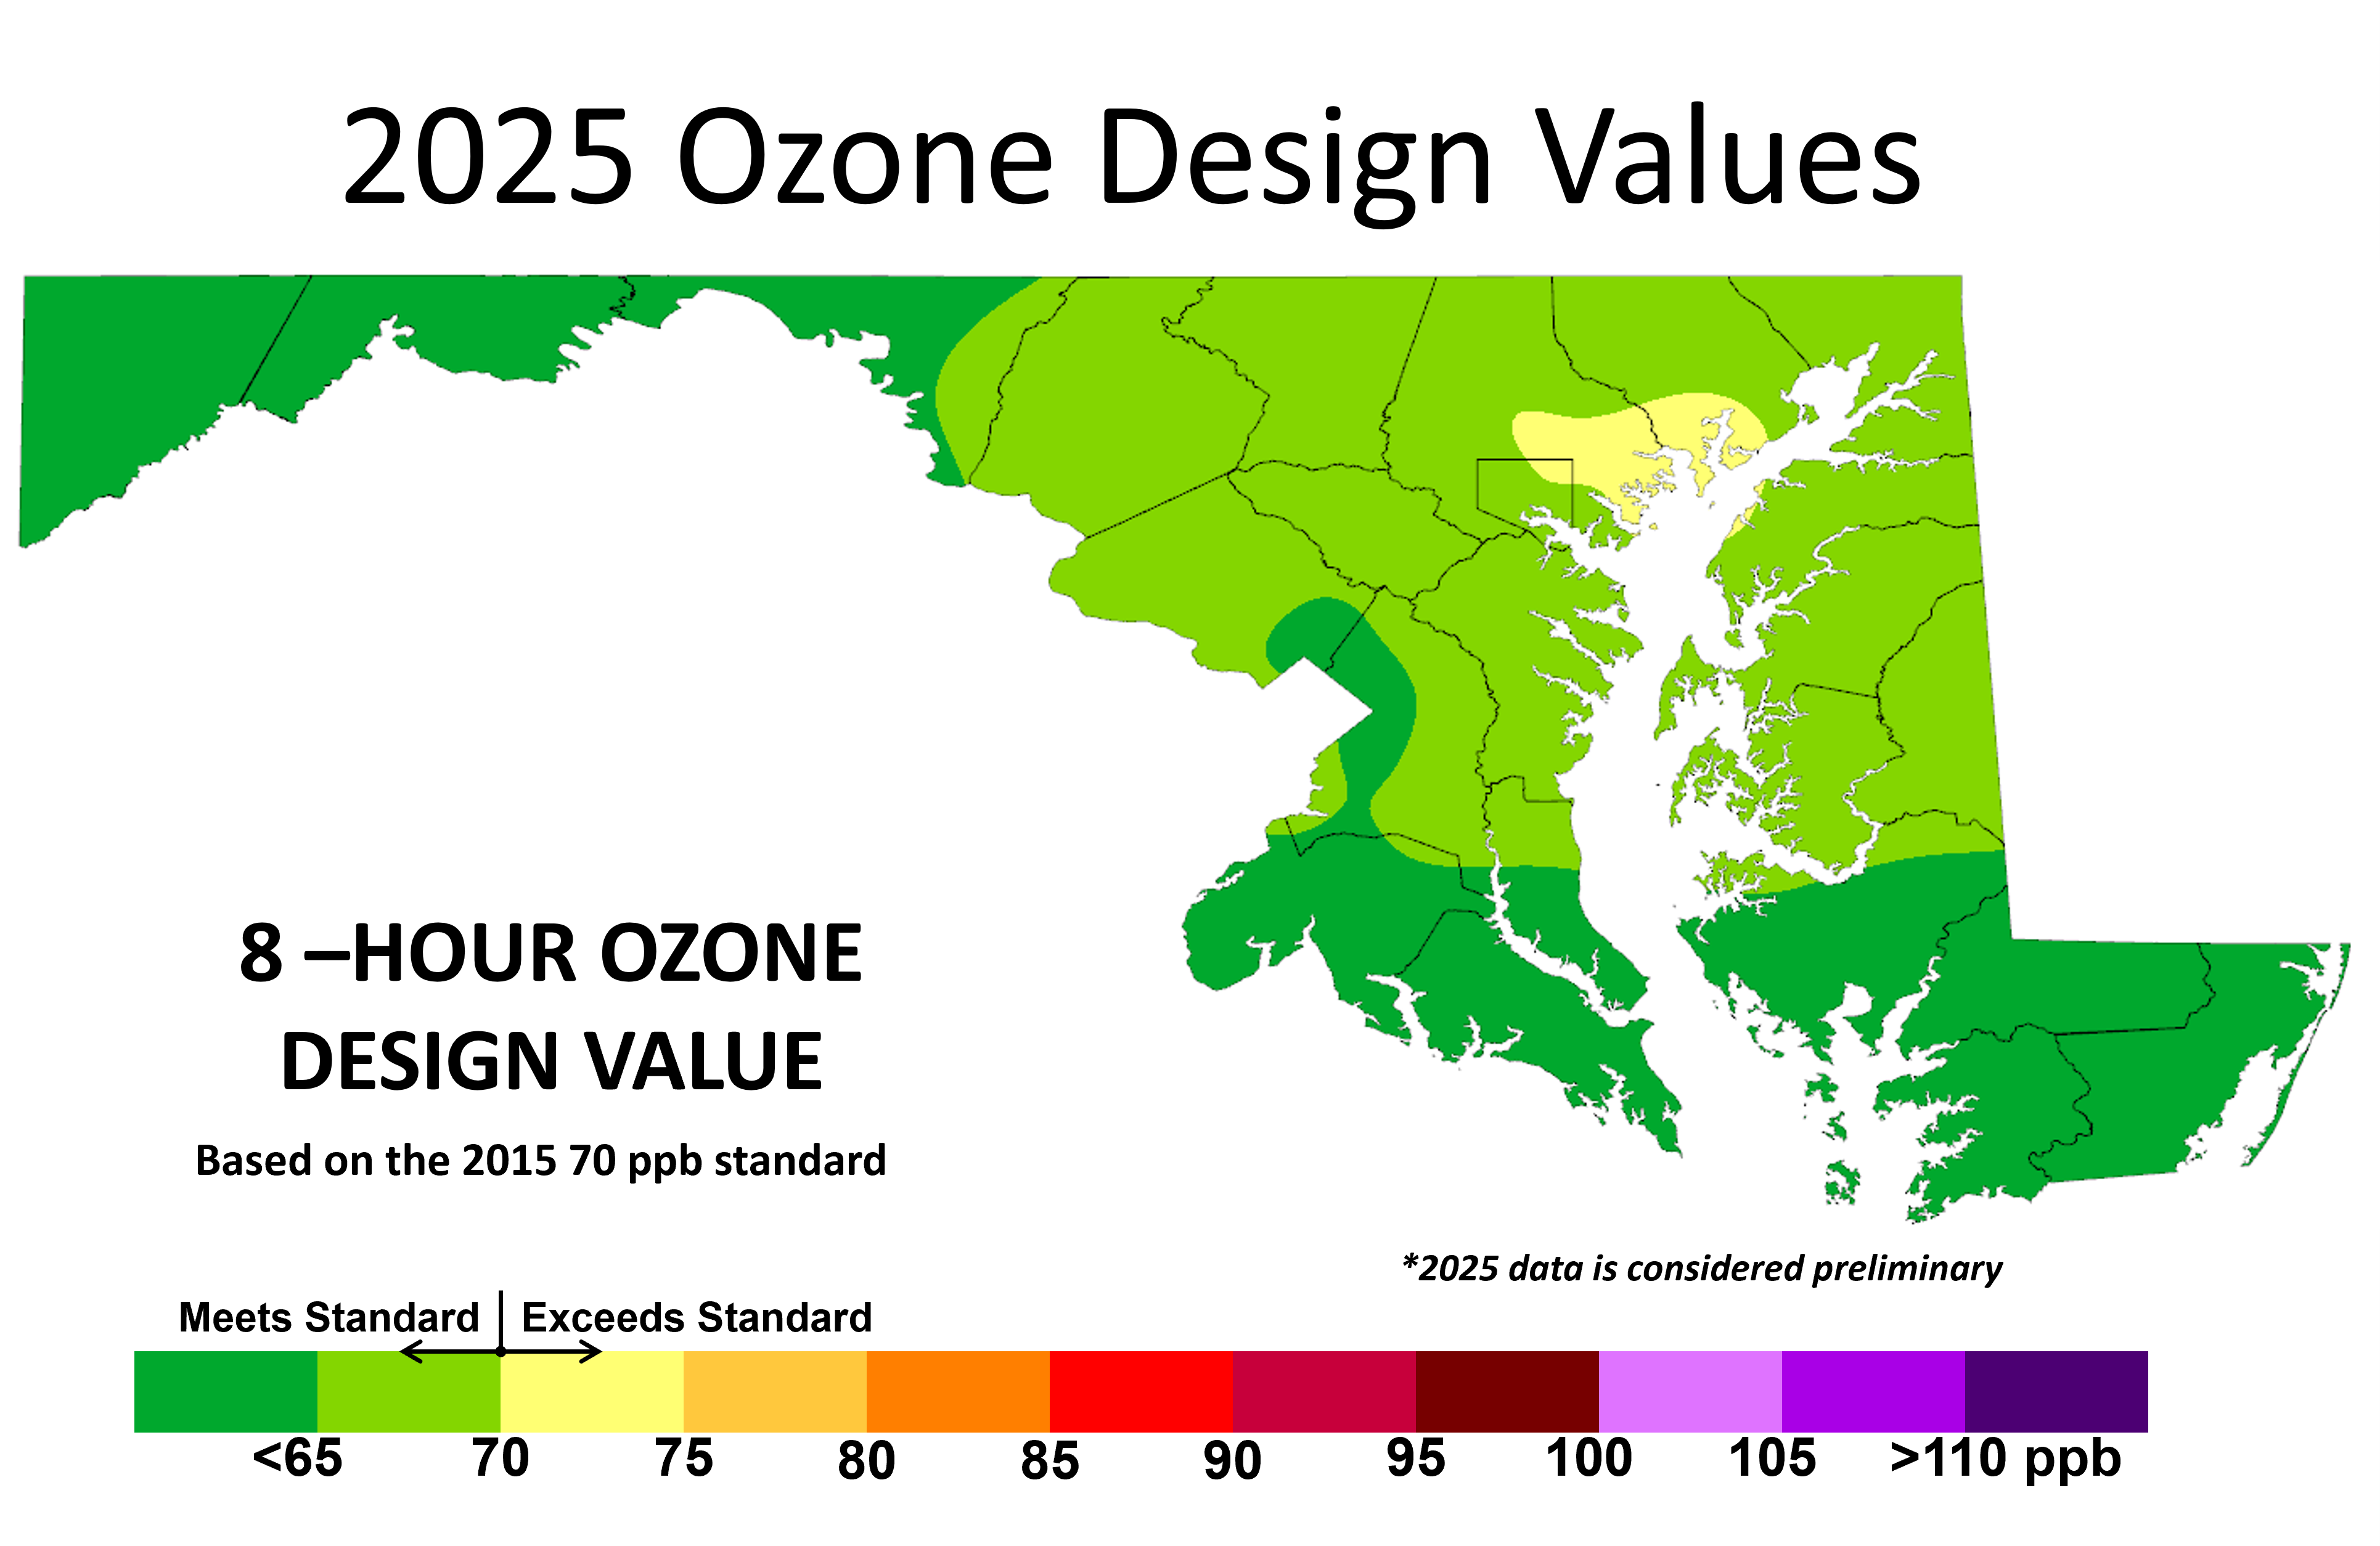
The Department has developed maps to help you visualize Maryland's air quality improvements. The maps illustrate how lower ozone levels have led to smaller problem areas.

8-Hour Ozone Exceedance Days
 The annual list of the 8-hour ozone concentrations exceeding the 2008 health-based National Ambient Air Quality Standard is provided below. Click on the appropriate check mark to download the data in Excel format. Be advised that the counts of days reflect all monitors that are part of the non-attainment area (NAA); however, only Maryland data collected by the Department and the
EPA Clean Air Status and Trends Network (CASTNET) are provided in the Excel file. A
map of NAAs shows the Maryland NAAs and surrounding jurisdictions.
Historical air quality data is also accessible at
Clean Air Partners,
EPA Air Data, and other data resources listed below.
Data Resources
