Maryland precipitation indicators for the periods ending 31-Aug-2019
Main_Content
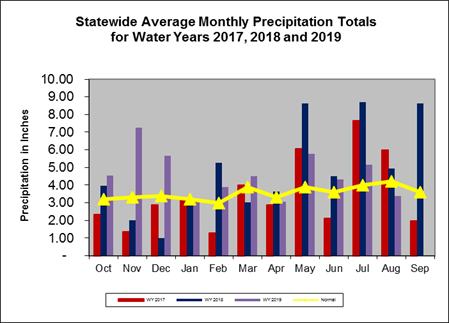
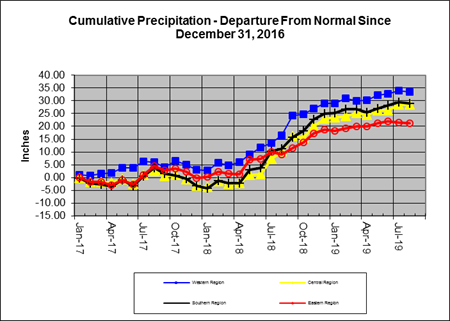
Maryland precipitation indicators for the periods ending 31-Aug-2019
Precipitation Indicators for Maryland Drought Regions
August 31, 2019 |
|---|
| |
Since May 31, 2019 |
|
Since August 31, 2018 |
| Regions |
Percent of Normal |
Condition |
Percent of Normal |
Condition |
Percent of Normal |
Condition |
| Western |
111% |
Normal |
124% |
Normal |
141% |
Normal |
| Central |
119% |
Normal |
130% |
Normal |
141% |
Normal |
| Eastern |
100% |
Normal |
125% |
Normal |
128% |
Normal |
| Southern |
117% |
Normal |
134% |
Normal |
141% |
Normal |
| 1WY or Water Year begins on October 1. |
Related Topics
For More Information
