Maryland precipitation indicators for the periods ending 31-May-2019
Main_Content
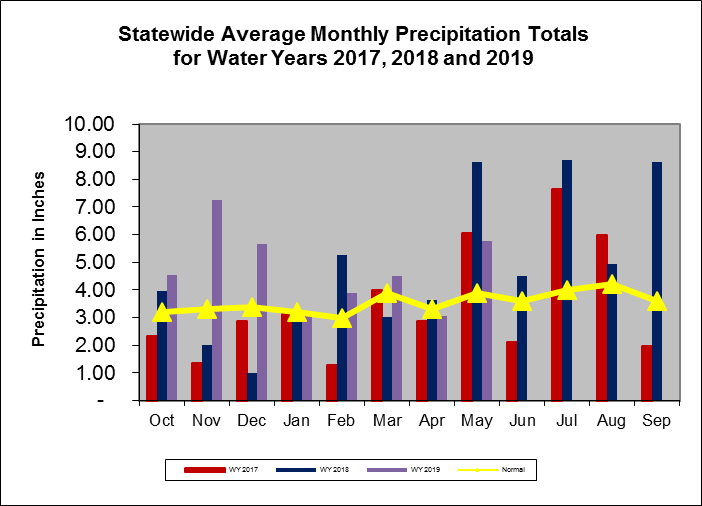
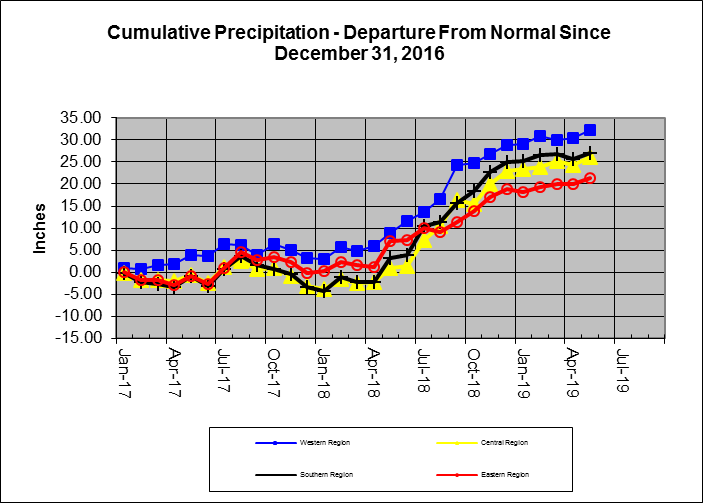
Maryland precipitation indicators for the periods ending 31-May-2019
Precipitation Indicators for Maryland Drought Regions
May 31, 2019 |
|---|
| |
Since Feb 28, 2019 |
|
Since May 31, 2018 |
| Regions |
Percent of Normal |
Condition |
Percent of Normal |
Condition |
Percent of Normal |
Condition |
| Western |
112% |
Normal |
130% |
Normal |
155% |
Normal |
| Central |
119% |
Normal |
135% |
Normal |
157% |
Normal |
| Eastern |
118% |
Normal |
135% |
Normal |
133% |
Normal |
| Southern |
103% |
Normal |
140% |
Normal |
155% |
Normal |
| 1WY or Water Year begins on October 1. |
Related Topics
For More Information
