Maryland precipitation indicators for the periods ending 31-January-2019
Main_Content
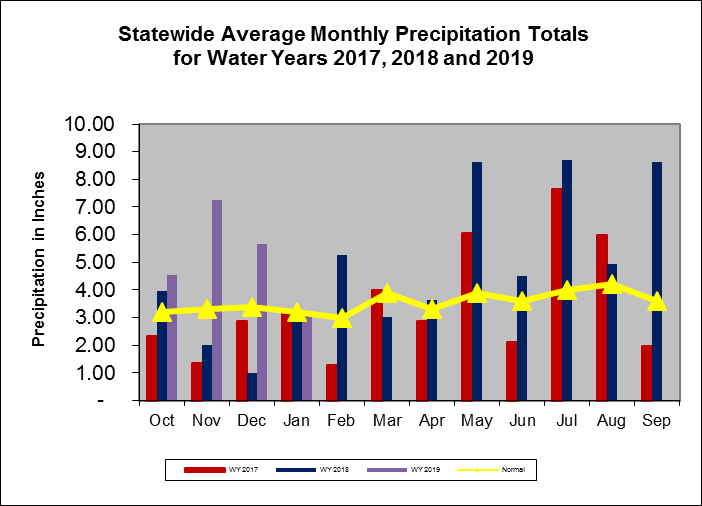
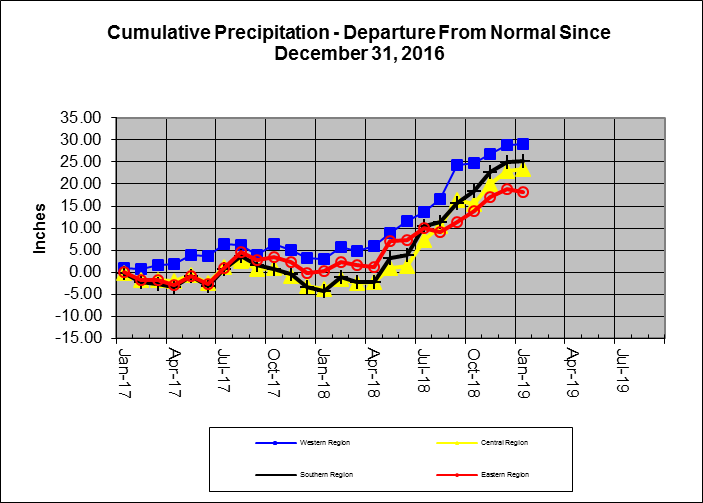
Maryland precipitation indicators for the periods ending 31-Jan-2019
Precipitation Indicators for Maryland Drought Regions
January 31, 2019 |
|---|
| |
WY to Date |
Since Jul 31, 2018 |
Since Jan 31, 2018 |
| Regions |
Percent of Normal |
Condition |
Percent of Normal |
Condition |
Percent of Normal |
Condition |
| Western |
139% |
Normal |
179% |
Normal |
162% |
Normal |
| Central |
151% |
Normal |
175% |
Normal |
161% |
Normal |
| Eastern |
150% |
Normal |
139% |
Normal |
141% |
Normal |
| Southern |
170% |
Normal |
171% |
Normal |
168% |
Normal |
| 1WY or Water Year begins on October 1. |
Related Topics
For More Information
