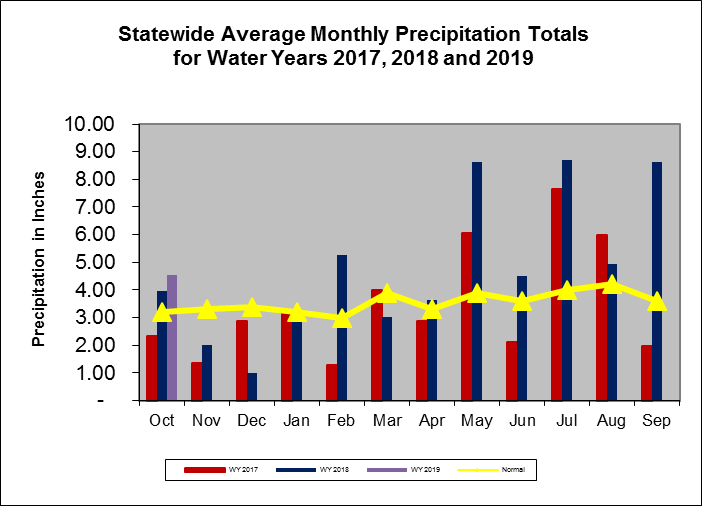
Maryland precipitation indicators for the periods ending 31-October-2018
Main_Content
Maryland precipitation indicators for the periods ending 31-Oct-2018
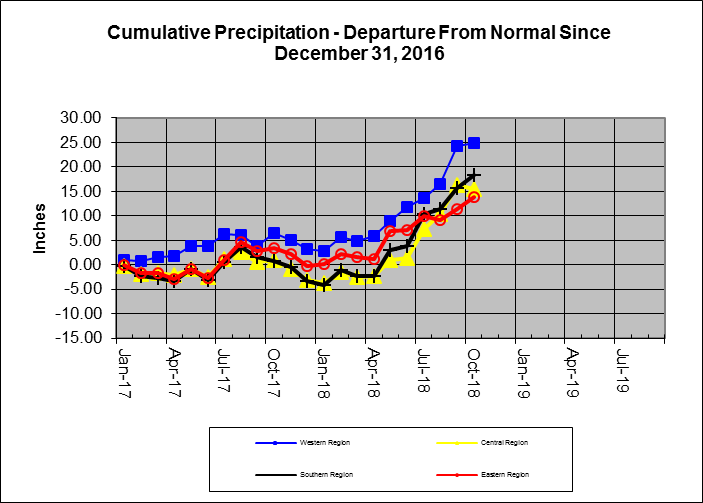
Precipitation Indicators for Maryland Drought Regions
October 31, 2018 |
|---|
| |
Since Jul 31, 2018 |
Since Apr 30, 2018 |
WY to Date |
| Regions |
Percent of Normal |
Condition |
Percent of Normal |
Condition |
Percent of Normal |
Condition |
| Western |
212% |
Normal |
184% |
Normal |
144% |
Normal |
| Central |
172% |
Normal |
175% |
Normal |
133% |
Normal |
| Eastern |
134% |
Normal |
155% |
Normal |
124% |
Normal |
| Southern |
172% |
Normal |
189% |
Normal |
141% |
Normal |
| 1WY or Water Year begins on October 1. |
Related Topics
For More Information
