Maryland precipitation indicators for the periods ending 30-September-2018
Main_Content
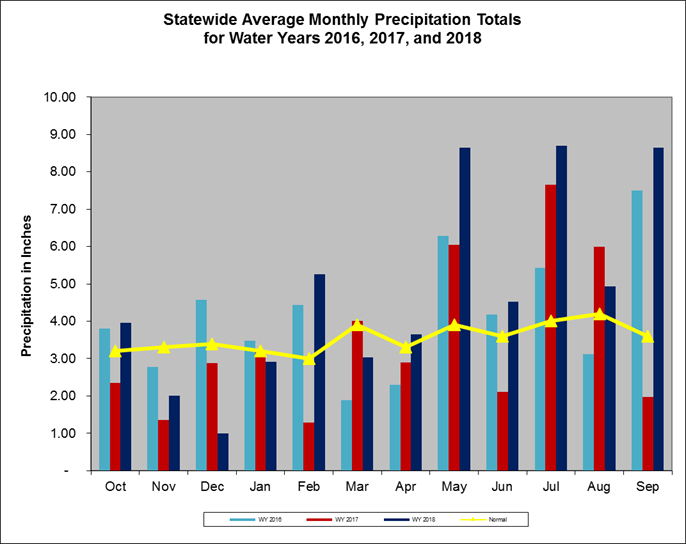
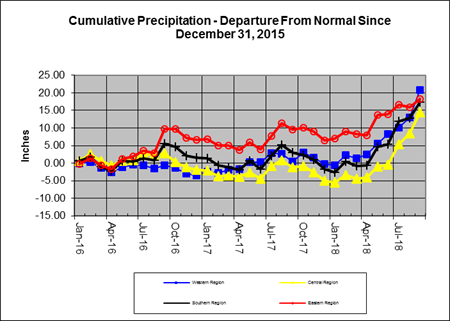
Maryland precipitation indicators for the periods ending 30-Sep-2018
Precipitation Indicators for Maryland Drought Regions
September 30, 2018 |
|---|
| |
Since Jun 30, 2018 |
Since Mar 31, 2018 |
WY to Date |
| Regions |
Percent of Normal |
Condition |
Percent of Normal |
Condition |
Percent of Normal |
Condition |
| Western |
213% |
Normal |
184% |
Normal |
148% |
Normal |
| Central |
227% |
Normal |
180% |
Normal |
136% |
Normal |
| Eastern |
135% |
Normal |
142% |
Normal |
120% |
Normal |
| Southern |
203% |
Normal |
179% |
Normal |
133% |
Normal |
| 1WY or Water Year begins on October 1. |
Related Topics
For More Information
