Maryland precipitation indicators for the periods ending 31-July-2018
Main_Content
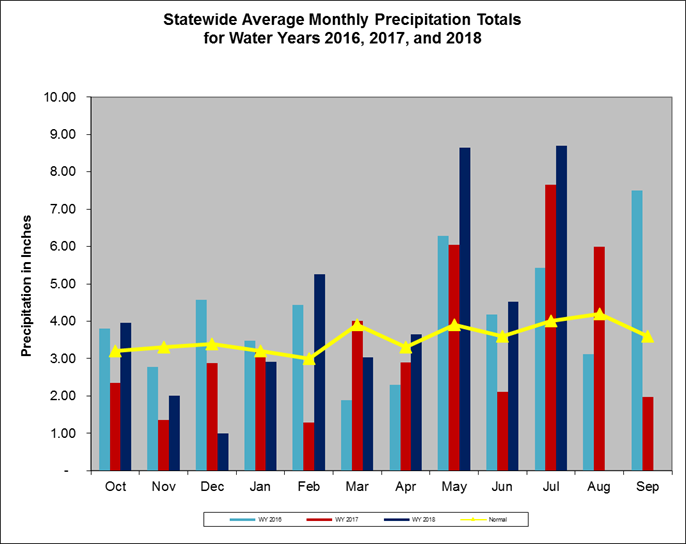
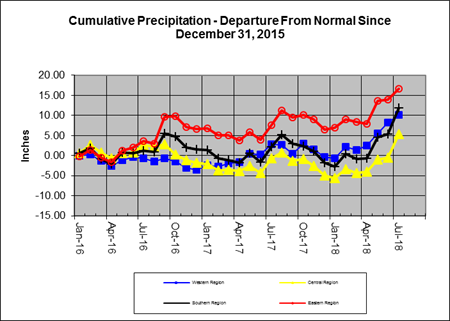
Maryland precipitation indicators for the periods ending 31-July-2018
Precipitation Indicators for Maryland Drought Regions
July 31, 2018 |
|---|
| |
Since Apr 30, 2018 |
WY to Date |
Since Jul 31, 2017 |
| Regions |
Percent of Normal |
Condition |
Percent of Normal |
Condition |
Percent of Normal |
Condition |
| Western |
162% |
Normal |
128% |
Normal |
117% |
Normal |
| Central |
177% |
Normal |
118% |
Normal |
114% |
Normal |
| Eastern |
175% |
Normal |
120% |
Normal |
121% |
Normal |
| Southern |
205% |
Normal |
125% |
Normal |
123% |
Normal |
| 1WY or Water Year begins on October 1. |
Related Topics
For More Information
