Maryland precipitation indicators for the periods ending 30-Sep-2017
Main_Content
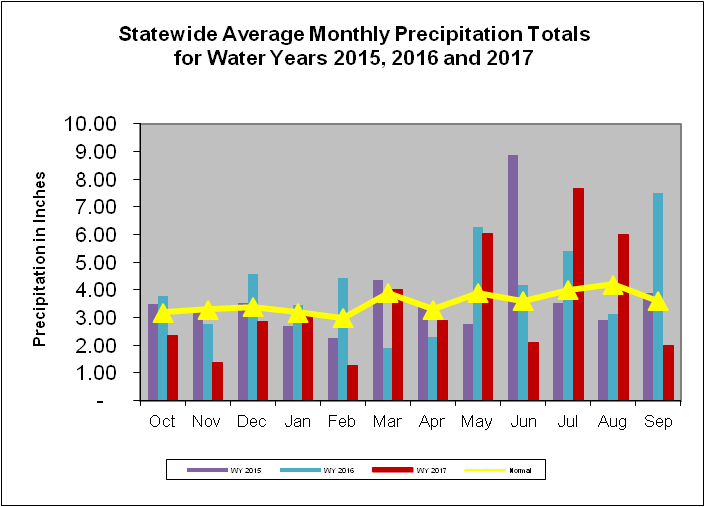
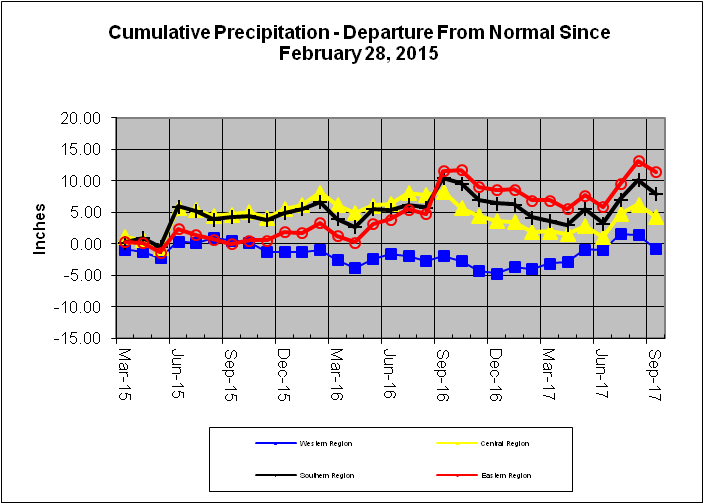
Maryland precipitation indicators for the periods ending 30-Sep-2017
Precipitation Indicators for Maryland Drought Regions
September 30, 2017 |
|---|
| |
Since Jun 30, 2017 |
Since Mar 31, 2017 |
WY to Date |
| Regions |
Percent of Normal |
Condition |
Percent of Normal |
Condition |
Percent of Normal |
Condition |
| Western |
102% |
Normal |
110% |
Normal |
103% |
Normal |
| Central |
127% |
Normal |
110% |
Normal |
91% |
Normal |
| Eastern |
146% |
Normal |
119% |
Normal |
94% |
Normal |
| Southern |
141% |
Normal |
119% |
Normal |
100% |
Normal |
| 1WY or Water Year begins on October 1. |
Related Topics
For More Information
