Precipitation Indicators for the Central and Eastern Maryland Drought Regions
Main_Content
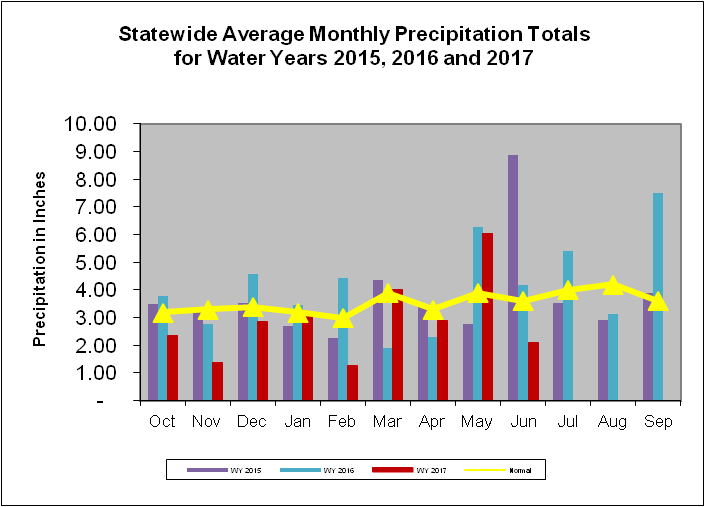
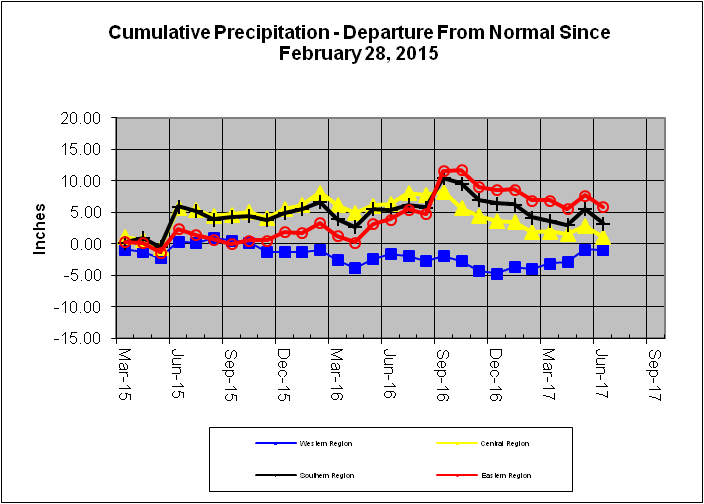
Maryland precipitation indicators for the Central and Eastern drought regions for the periods ending 30-Jun-2017
Precipitation Indicators for Maryland Drought Regions
June 30, 2017 |
|---|
| |
Since Mar 31, 2017 |
WY to Date |
Since June 30, 2016 |
| Regions |
Percent of Normal |
Condition |
Percent of Normal |
Condition |
Percent of Normal |
Condition |
| Western |
118% |
Normal |
103% |
Normal |
102% |
Normal |
| Central |
93% |
Normal |
78% |
Watch |
88% |
Normal |
| Eastern |
90% |
Normal |
82% |
Normal |
104% |
Normal |
| Southern |
96% |
Normal |
77% |
Watch |
95% |
Normal |
| 1WY or Water Year begins on October 1. |
Related Topics
For More Information
