Precipitation Indicators for Maryland Drought Regions
Main_Content
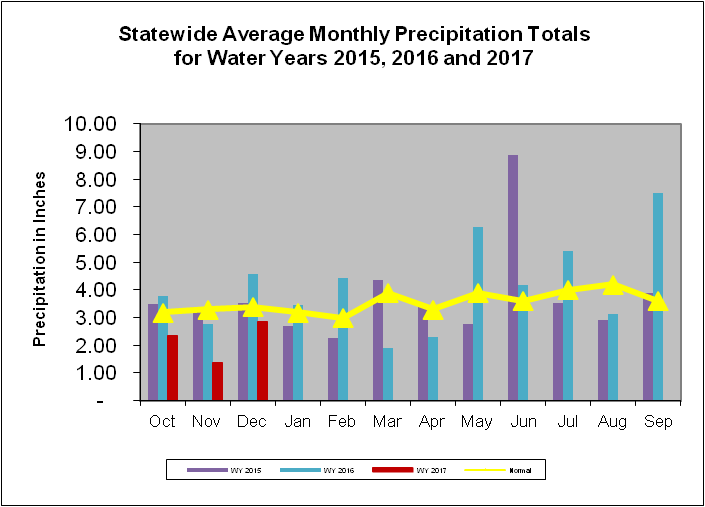
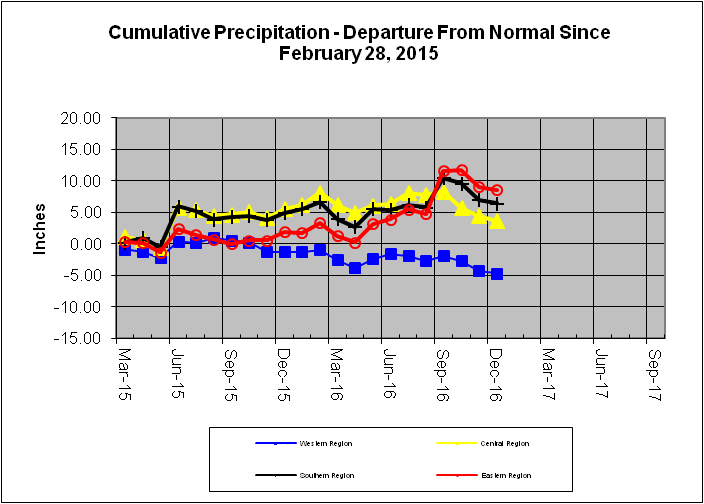
Maryland precipitation indicators for periods ending 15-Jan-2017
|
Precipitation Indicators for Maryland Drought Regions
Jan 15, 2016 |
|
WY to date |
Since Jul 31, 2016 |
Since Jan 31, 2016 |
| Regions |
Percent of Normal |
Condition |
Percent of Normal |
Condition |
Percent of Normal |
Condition |
| Western |
81% |
Normal |
88% |
Normal |
93% |
Normal |
| Central |
63% |
Warning |
78% |
Watch |
95% |
Normal |
| Eastern |
78% |
Normal |
118% |
Normal |
118% |
Normal |
| Southern |
68% |
Normal |
102% |
Normal |
103% |
Normal |
| 1WY or Water Year begins on October 1. |
Related Topics
For More Information
Please contact the Water Supply Program at [email protected] or 410-537-3702
