Precipitation Indicators for Maryland Drought Regions
Main_Content
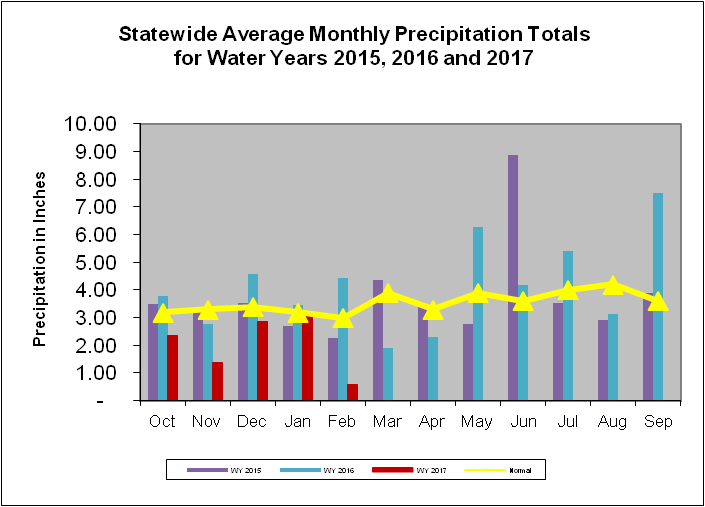
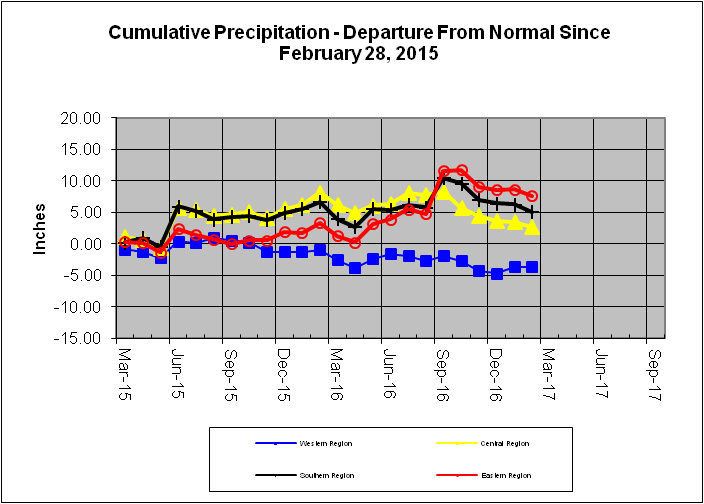
Maryland precipitation indicators for periods ending 14-Feb-2017
|
Precipitation Indicators for Maryland Drought Regions
February 14, 2017 |
|
WY to Date |
Since Aug 31, 2016 |
Since Feb 29, 2016 |
| Regions |
Percent of Normal |
Condition |
Percent of Normal |
Condition |
Percent of Normal |
Condition |
| Western |
88% |
Normal |
95% |
Normal |
93% |
Normal |
| Central |
63% |
Warning |
74% |
Watch |
87% |
Normal |
| Eastern |
73% |
Watch |
115% |
Normal |
110% |
Normal |
| Southern |
64% |
Warning |
96% |
Normal |
96% |
Normal |
| 1WY or Water Year begins on October 1. |
Related Topics
For More InformationPlease contact the Water Supply Program at [email protected] or 410-537-3702
