Precipitation Indicators for Maryland Drought Regions
Main_Content
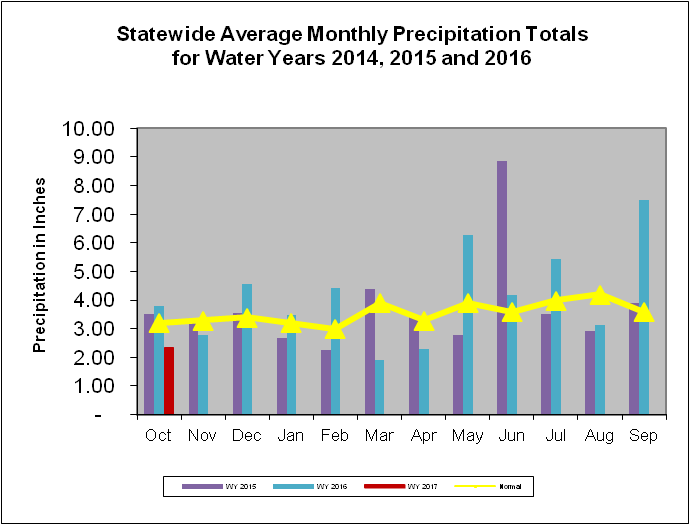
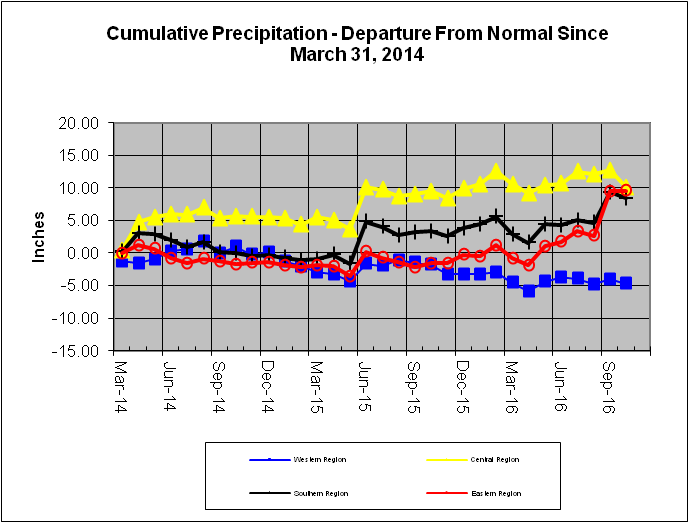
Maryland precipitation indicators for periods ending 31-Oct-2016
|
Precipitation Indicators for Maryland Drought Regions
October 31, 2016 |
|
Since Jul 31, 2016 |
Since Apr 30, 2016 |
Since Oct 31, 2015 |
| Regions |
Percent of Normal |
Condition |
Percent of Normal |
Condition |
Percent of Normal |
Condition |
| Western |
92% |
Normal |
105% |
Normal |
93% |
Normal |
| Central |
79% |
Normal |
104% |
Normal |
101% |
Normal |
| Eastern |
155% |
Normal |
150% |
Normal |
125% |
Normal |
| Southern |
131% |
Normal |
130% |
Normal |
112% |
Normal |
| 1WY or Water Year begins on October 1. |
Related Topics
For More Information
Please contact the Water Supply Program at [email protected] or 410-537-3702
