Precipitation Indicators for Maryland Drought Regions
Main_Content
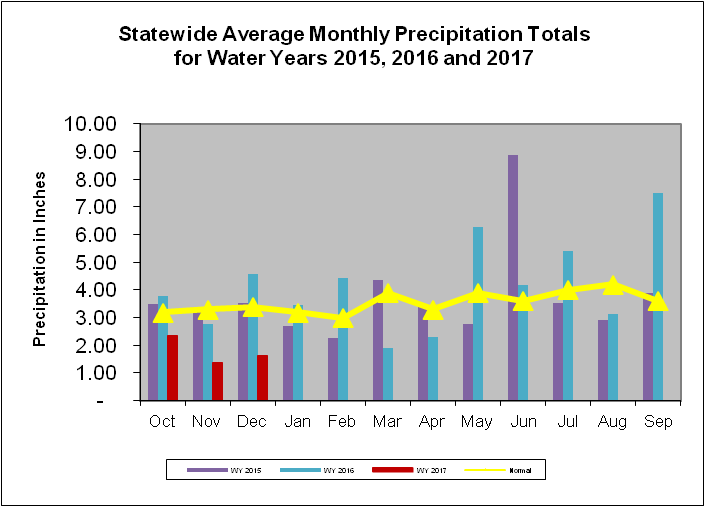
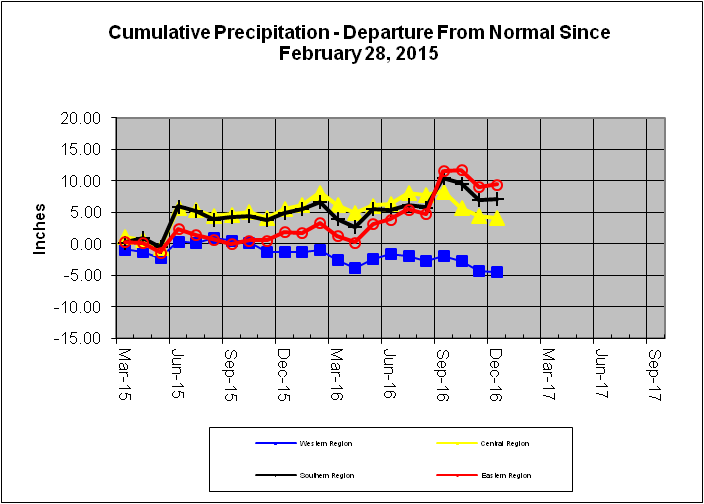
Maryland precipitation indicators for periods ending 14-Dec-2016
|
Precipitation Indicators for Maryland Drought Regions
December 14, 2016 |
|
WY to Date |
Since Jun 30, 2016 |
Since Dec 31, 2015 |
| Regions |
Percent of Normal |
Condition |
Percent of Normal |
Condition |
Percent of Normal |
Condition |
| Western |
68% |
Unknown |
85% |
Normal |
92% |
Normal |
| Central |
53% |
Unknown |
90% |
Normal |
97% |
Normal |
| Eastern |
74% |
Unknown |
127% |
Normal |
118% |
Normal |
| Southern |
61% |
Unknown |
109% |
Normal |
105% |
Normal |
| 1WY or Water Year begins on October 1. |
Related Topics
For More Information
Please contact the Water Supply Program at [email protected] or 410-537-3702
