Precipitation Indicators for the Central and Eastern Maryland Drought Regions
Main_Content
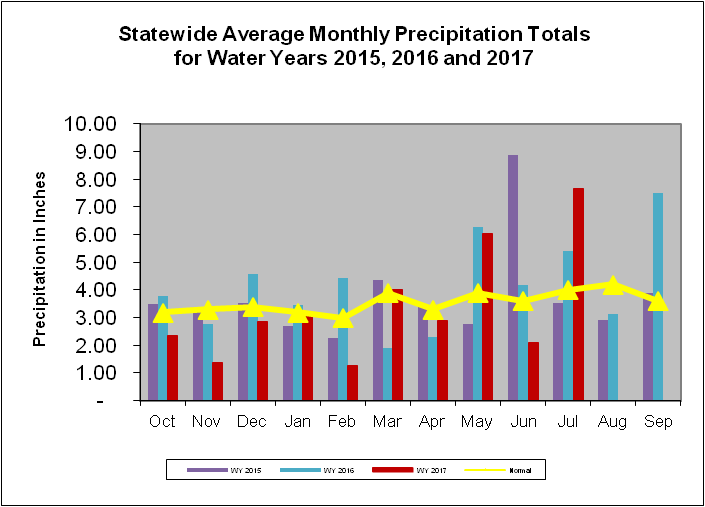
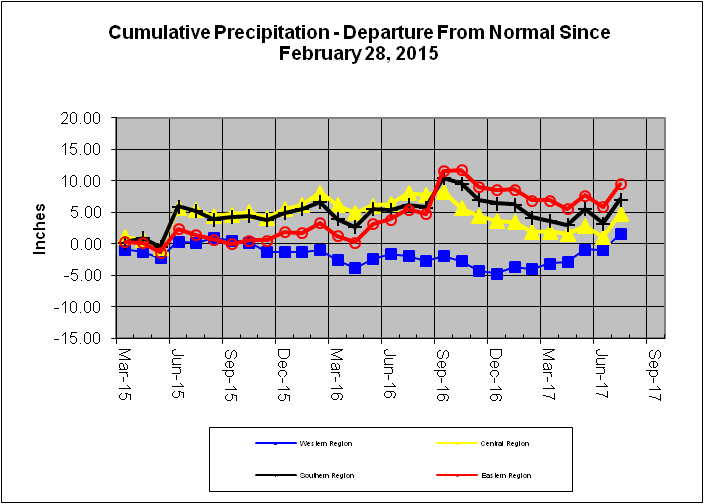
Maryland precipitation indicators for the Central and Eastern drought regions for the periods ending 31-Jul-2017
Precipitation Indicators for Maryland Drought Regions
July 31, 2017 |
|---|
| |
Since Apr 30, 2017 |
WY to Date |
Since Jul 31, 2016 |
| Regions |
Percent of Normal |
Condition |
Percent of Normal |
Condition |
Percent of Normal |
Condition |
| Western |
136% |
Normal |
110% |
Normal |
108% |
Normal |
| Central |
126% |
Normal |
90% |
Normal |
92% |
Normal |
| Eastern |
134% |
Normal |
94% |
Normal |
109% |
Normal |
| Southern |
133% |
Normal |
90% |
Normal |
102% |
Normal |
| 1WY or Water Year begins on October 1. |
Related Topics
For More Information
