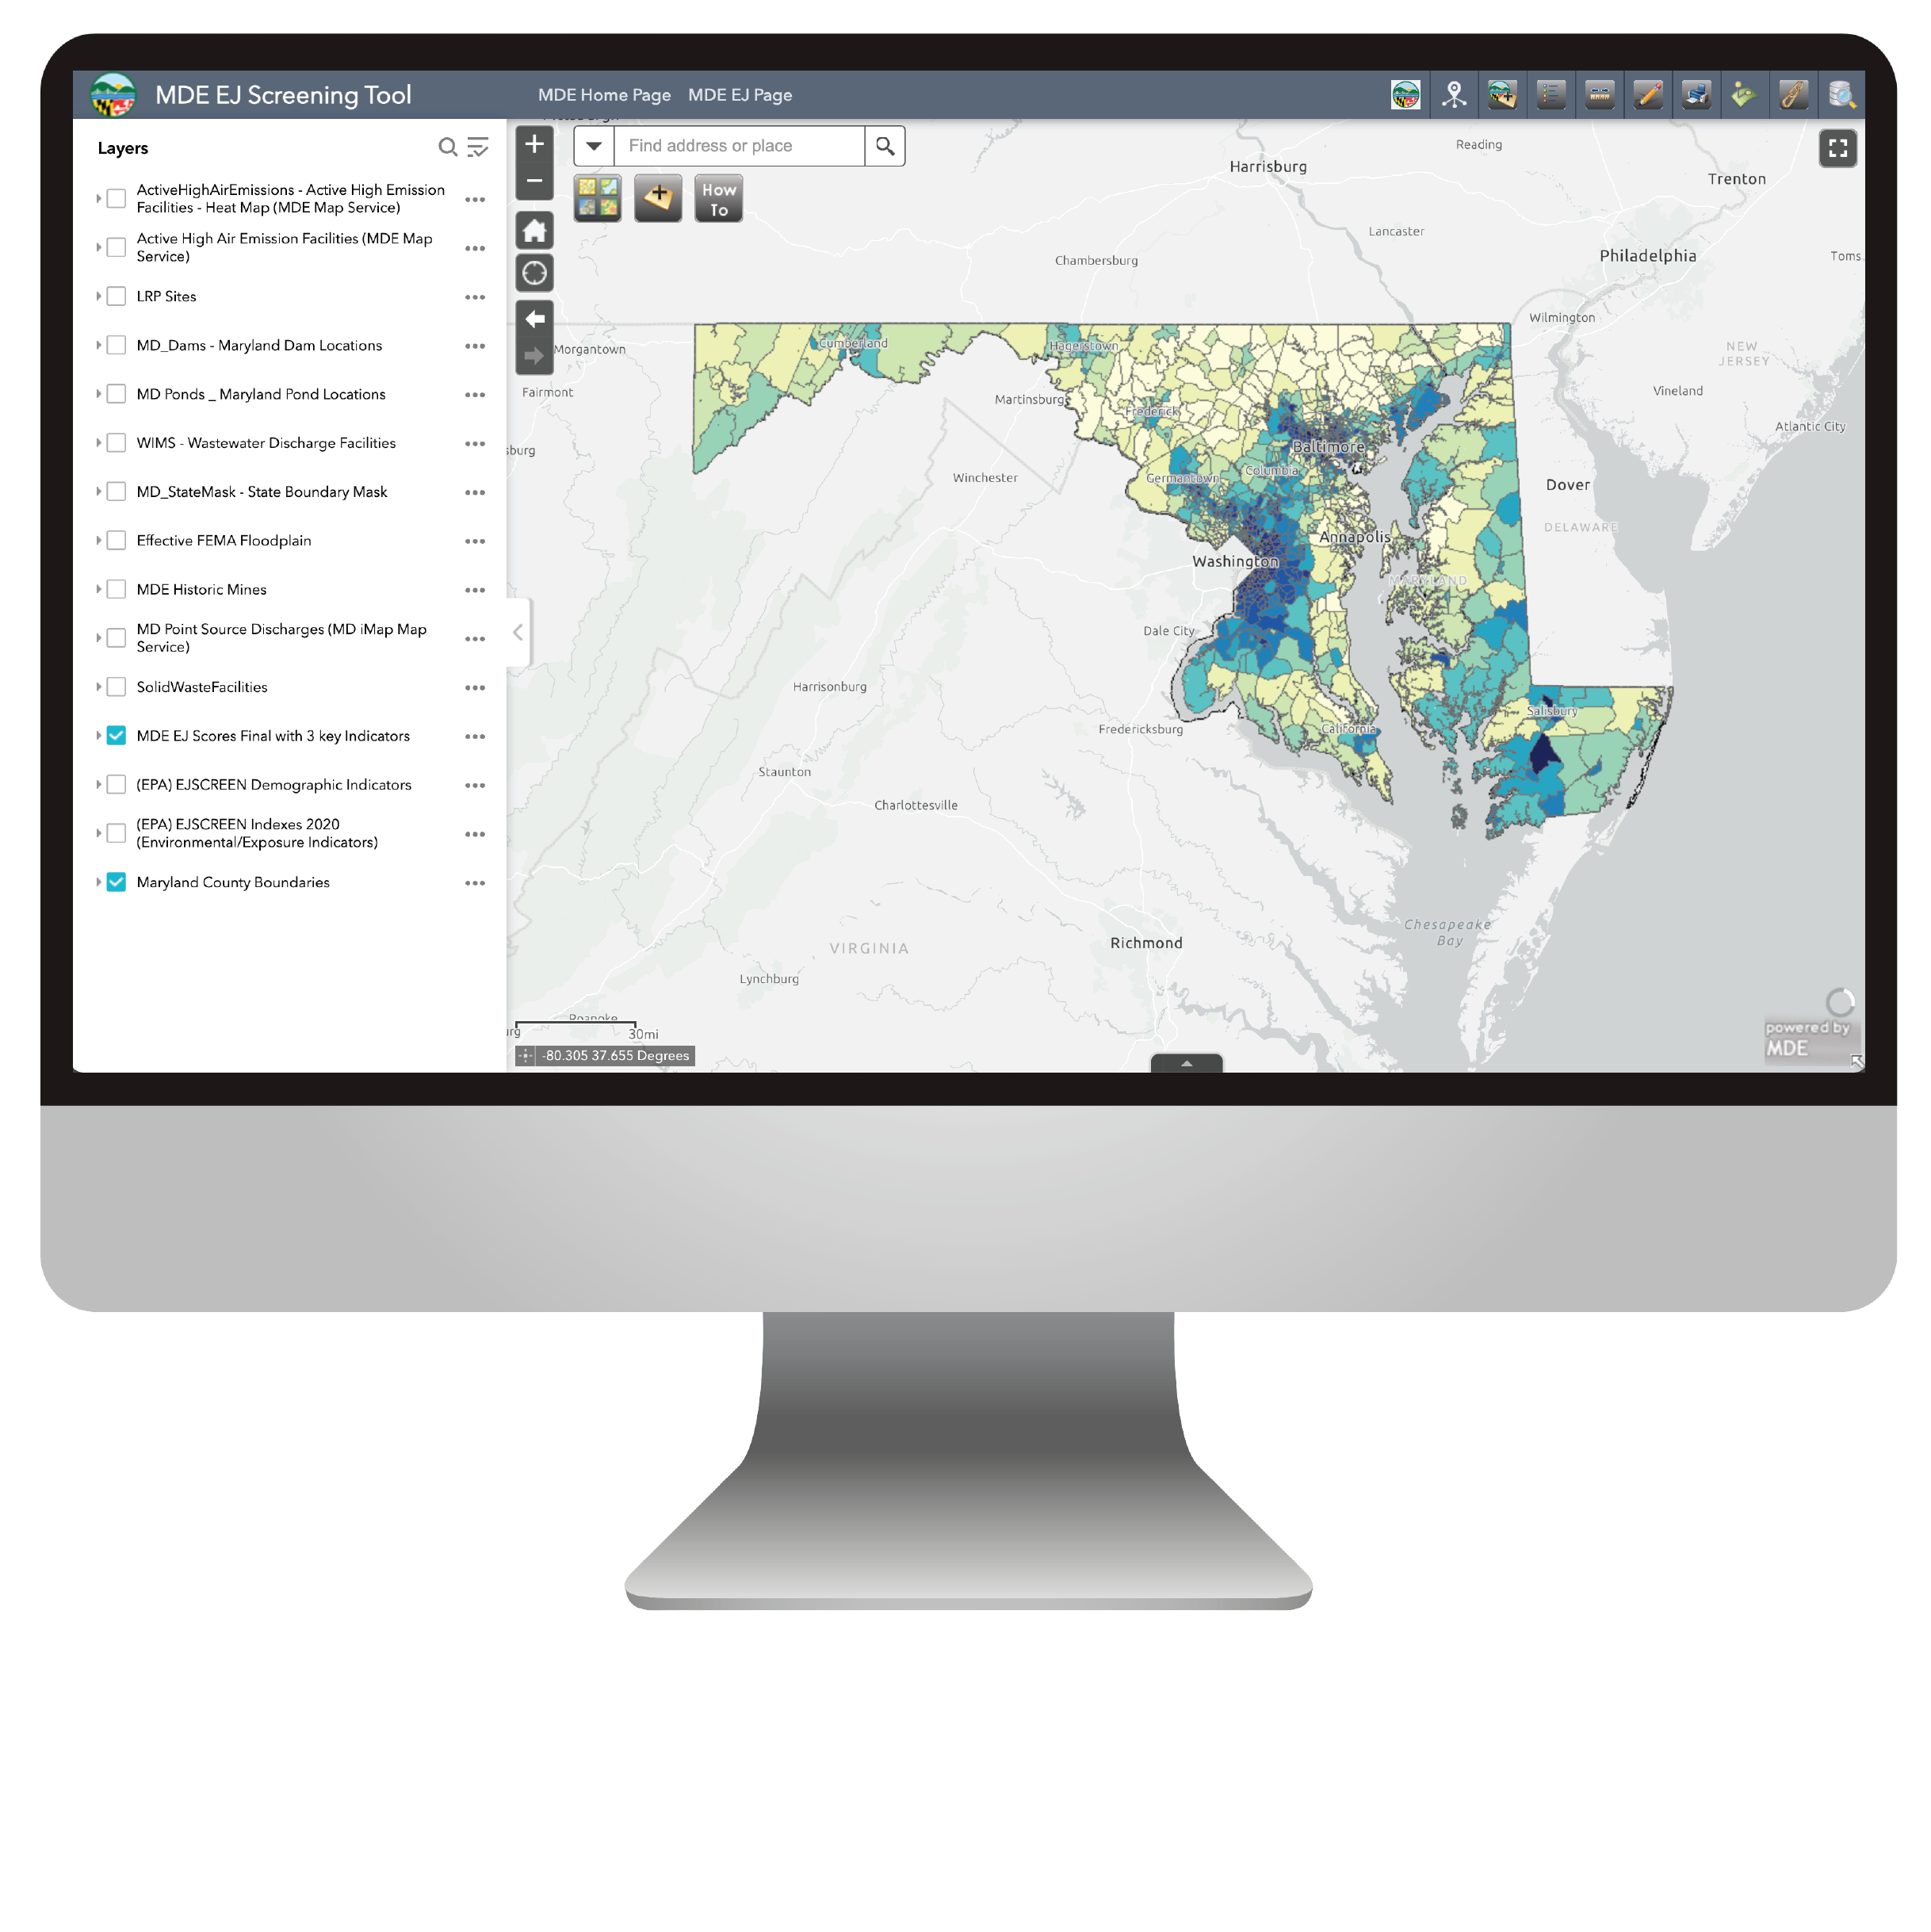
The goal of this tool is to provide users with data to inform their decisions on siting, permitting, enforcement, and infrastructure improvements. The demographic and socioeconomic data, coupled with MDE-specific elements such as proximity to active high air emission facilities, or wastewater treatment facilities, will be used to help underserved and overburdened communities in Maryland.
What are Underserved Communities?
State law defines Underserved Communities as “any census tract in which, according to the most recent U.S. census bureau survey:
(I) at least 25% of the residents qualify as low-income;
(II) at least 50% of the residents identify as nonwhite; or
(III) at least 15% of the residents have limited English proficiency.”
What are Overburdened Communities?
State law defines Overburdened Communities as “any census tract in which three or more of the following environmental health indicators are above the 75th percentile statewide:
(I) particulate matter (PM) 2.5;
(II) ozone;
(III) National Air Toxic Assessment (NATA) diesel PM;
(IV) NATA cancer risk;
(V) NATA respiratory hazard index;
(VI) traffic proximity;
(VII) lead paint indicator;
(VIII) national priorities list superfund site proximity;
(IX) risk management plan facility proximity;
(X) hazardous waste proximity;
(XI) wastewater discharge indicator;
(XII) proximity to a concentrated animal feeding operation (CAFO);
(XIII) percent of the population lacking broadband coverage;
(XIV) asthma emergency room discharges;
(XV) myocardial infarction discharges;
(XVI) low-birth-weight infants;
(XVII) proximity to emitting power plants;
(XVIII) proximity to a toxic release inventory (TRI) facility;
(XIX) proximity to a brownfields site;
(XX) proximity to mining operations; and
(XXI) proximity to a hazardous waste landfill”
How does MDE calculate an EJ Score?
MDE uses four indicators to screen locations and communities based on census and health data:
The definition of an overburdened community was used to calculate pollution burden exposure, pollution burden environmental effects, and sensitive populations. The definition of an underserved community was used to calculate socioeconomic/demographic factors.
Pollution Burden Exposure
MDE calculates the pollution burden exposure score as any census tract in which the following indicators are above the 75th percentile statewide:
- particulate matter (PM) 2.5
- ozone
- National Air Toxic Assessment (NATA) diesel PM
- NATA cancer risk
- NATA respiratory hazard index
- traffic proximity
- proximity to a toxic release inventory (TRI) facility
- proximity to a hazardous waste landfill
Pollution Burden Environmental Effects
MDE calculates the pollution burden environmental effects score as any census tract in which the following indicators are above the 75th percentile statewide:
- lead paint indicator
- risk management plan facility proximity
- hazardous waste proximity
- national priorities list superfund site proximity
- wastewater discharge indicator
- proximity to a brownfields site
- proximity to emitting power plants
- proximity to a concentrated animal feeding operation (CAFO)
- proximity to mining operations
Sensitive Populations
MDE calculates the sensitive populations score as any census tract in which the following indicators are above the 75th percentile statewide:
- low-birth-weight infants*
- asthma emergency room discharges*
- myocardial infarction discharges*
- percent of the population lacking broadband coverage+
*These indicators are not tracked on the 2020 census tract level; this data was derived from the United States Environmental Protection Agency and the University of Maryland who crosswalked back the 2020 data that was provided to them at the tract level. However, at the time of analysis the data was crosswalked back to the 2010 census tracts. This data is the best available data provided by hospitals, however, due to Heath Insurance Portability and Accountability Act (HIPAA), some areas may appear as being overburdened for sensitive populations due do a community's proximity to a hospital. Therefore this should be taken into consideration when reviewing this data.
+The broadband coverage data was derived from the American Community Survey.
Socioeconomic/Demographic Indicators
MDE calculates the socioeconomic/demographic score utilizing the definitions of an Underserved Community which
“means any census tract in which, according to the most recent U.S. census bureau survey:
- at least 25% of the residents qualify as low-income;
- at least 50% of the residents identify as nonwhite; or
- at least 15% of the residents have limited English proficiency.”
Note this is an “or” definition, therefore if one or more of the indicators meets the threshold, then the census tract is automatically classified as underserved.